

Short answer
The best time to visit Koh Samui is February to April, when the island has the fewest rainy days: 4.3 in February, 4.7 in March and 6.1 in April, according to the 1991 to 2020 normals. January is also good. May to September is warmer, with about 10 to 11 rainy days a month, and October to December is the wet season, peaking at 444.6 mm in November. The Ang Thong marine park is closed from 1 November to 15 December 2026.
February to April is the driest stretch
The rainfall data points to February, March and April. In the World Meteorological Organization's 1991 to 2020 normals for the Ko Samui station, February has 4.3 days with at least 1 mm of rain, March 4.7 and April 6.1. Those are the lowest counts of the year, against 10 to 11 days from May to September and 15.8 and 16.5 days in October and November. January is a good shoulder month: 8.5 rainy days and 126.8 mm.
It also gets warmer through the stretch. The average daytime high rises from 29.4 degrees in February to 30.4 in March and 31.8 in April, with relative humidity of 80.7 to 81.2 per cent. If you want a beach week with the best odds of dry weather, aim at these three months.
May to September: warmer, with showers, and drier than Phuket
This is the surprise for first-time visitors. Between May and September Koh Samui receives roughly 102 to 134 mm of rain a month on 10 to 11 days, according to the same normals, and the average daytime high is 31.9 to 32.9 degrees. Showers come and go. Compare that with Phuket across the island chain: its station's normals show 240 to 350 mm a month from June to September, on 16 to 19 rainy days.
That gap is the reason many travellers switch coasts for the middle of the year. May is the hottest month on Samui, with an average high of 32.9 degrees. Showers are the rule rather than the exception, but the data does not show a month that is unusable. Our Pig Island day and Ang Thong day both run in these months, subject to the sea on the day.
October to December: the Gulf's wet season
Koh Samui's rain peaks late. October brings 294.9 mm on 15.8 days, November 444.6 mm on 16.5 days, and December 263.1 mm on 11.6 days. The annual total in the table is 1,994 mm, so these three months supply about half of it. The Thai Meteorological Department attributes this to the north-east monsoon and a low-pressure trough over the Gulf of Thailand, which keep the east coast of the south wet in November and early December.
The sea follows the rain. The Department's winter outlook issued on 27 September 2024 expected Gulf waves of 2 to 4 metres at times from late October to early January. For month-level detail see Koh Samui in November and Koh Samui in December. Treat late October to mid-December as the months to avoid if a calm sea matters to you.
Gulf coast or Andaman: who is wet when
The two coasts have opposite calendars. Phuket's normals show its rain peaking in September and October, at 350.4 and 336.0 mm, and falling to 24.0 mm in February. Samui's peak is November and its February is 64.3 mm. In January to March Phuket has 2 to 6 rainy days a month and Samui between 4 and 8.5, so both coasts are dry then. From June to September Samui is much the drier of the two.
That makes a simple rule. For January to March either coast works. For June to September the Gulf coast is the safer bet. For November and December look to the Andaman side. Our Andaman or Gulf coast guide and the Phuket or Koh Samui comparison set the two coasts side by side if you are still choosing where to go.
When Ang Thong is open
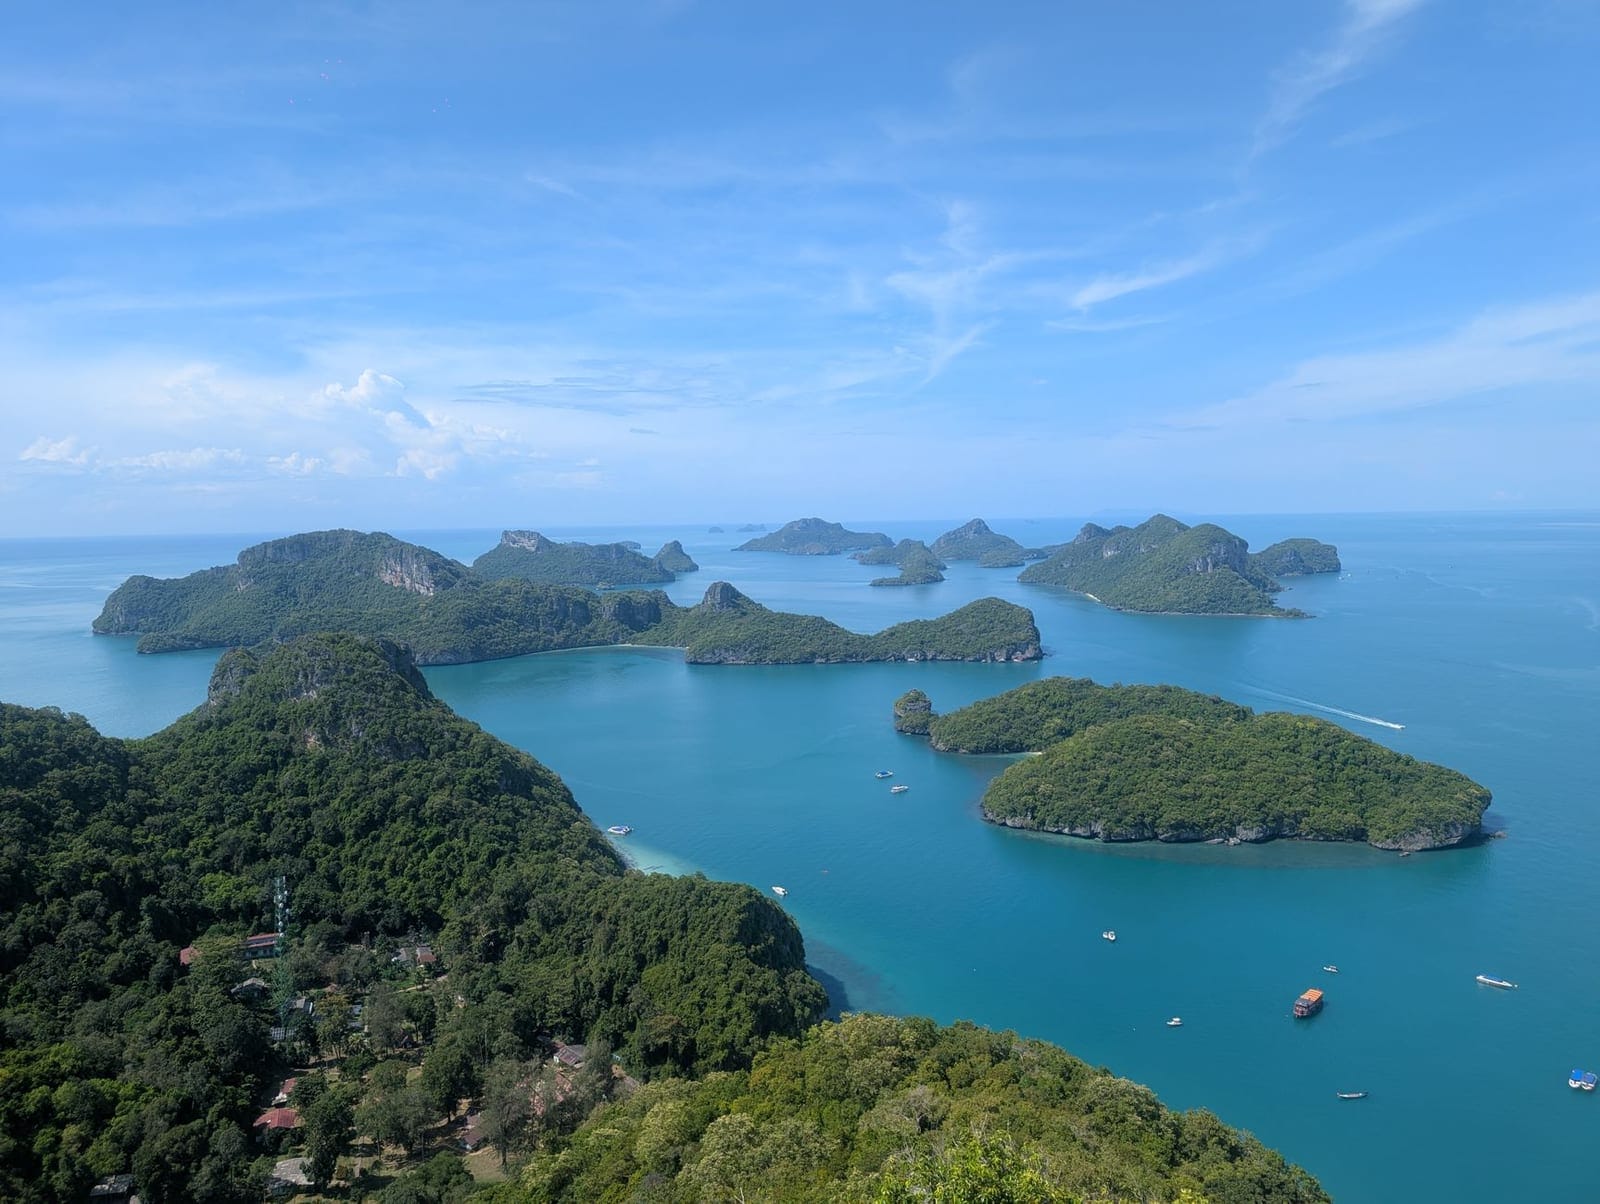
Ang Thong National Marine Park closes every year for the monsoon. Asian Trails reported on 25 September 2026 that this year's closure runs from 1 November to 15 December 2026, a closure of 45 days, and the park reopens on 16 December. Outside those dates our Ang Thong day runs, from $50 per person, about 8 to 9 hours with hotel pickup between about 7:30 and 8:30 am.
The park fee is paid on the day and is not in the tour price. If the sea is unsafe, the operator moves the trip to another date or refunds it. Wikipedia describes the park as 42 islands in about 102 square kilometres. The price and closure guide covers the fee and the options, and the Ang Thong or Pig Island guide helps if your dates fall in the closure.
Heat and humidity through the year
Temperatures on Samui move less than the rain. The average night low stays between 24.0 and 26.0 degrees all year, and the average daytime high runs from 29.0 degrees in January to 32.9 in May. The warmest months are April to September, when the average high is 31.8 degrees or more. Relative humidity runs from 78.0 per cent in August to 85.5 in November.
So the choice between months is about rain and sea, not about heat. If you struggle with heat, January and February are the mildest at 29.0 and 29.4 degrees by day. If you struggle with damp air, June to August are the least humid. Whatever the month, bring sun protection for boat days.
Which month for which kind of trip
For a beach holiday with the least weather risk, pick February to April, and keep January as a back-up. For a warmer trip with showers, when the Andaman coast is at its wettest, pick June to September. For a trip built around Ang Thong, aim at any month from 16 December to 31 October, with the dry months giving the best odds of dry weather.
If November or early December is your only window, go in with open eyes: accept rain, keep one spare day for boat trips, and use the short, close-to-shore options such as Pig Island. Our things to do guide lists land-based plans for wet days.
Practical checklist
- Choose February to April if you want the fewest rainy days, and January as a back-up.
- Avoid late October to mid-December if a calm sea matters to you.
- Do not plan an Ang Thong day between 1 November and 15 December 2026.
- Compare the Andaman coast for November and December, and the Gulf for June to September.
- Leave a spare day in your week for any boat trip, whatever the month.
- Pack sun protection and a dry bag all year: the average daytime high is 29 to 33 degrees.
Questions and answers
What is the best month to visit Koh Samui?
February to April have the fewest rainy days in the 1991 to 2020 normals: 4.3, 4.7 and 6.1. March is a good all-round pick, with 4.7 rainy days and an average high of 30.4 degrees.
What is the rainiest month on Koh Samui?
November, with an average of 444.6 mm of rain on 16.5 days in the 1991 to 2020 normals. October and December follow, with 294.9 and 263.1 mm.
Is Koh Samui good in July and August?
Yes, for the Gulf. Both months have about 10 to 11 rainy days and 102 to 117 mm of rain, against 240 to 309 mm on the Andaman side at Phuket. Days are hot, with highs of about 32 degrees.
Is Ang Thong open all year?
No. It closes every year for the monsoon. This year the closure runs from 1 November to 15 December 2026, and the park reopens on 16 December, according to Asian Trails.
Does Samui have the same rainy season as Phuket?
No. Phuket's wettest months are September and October, while Samui's are October to December. From June to September Samui is much drier than Phuket.
Is January a good month to go?
Yes, as a shoulder month. January has 8.5 rainy days and 126.8 mm of rain, more than February to April but far less than November, and the average high is 29.0 degrees.